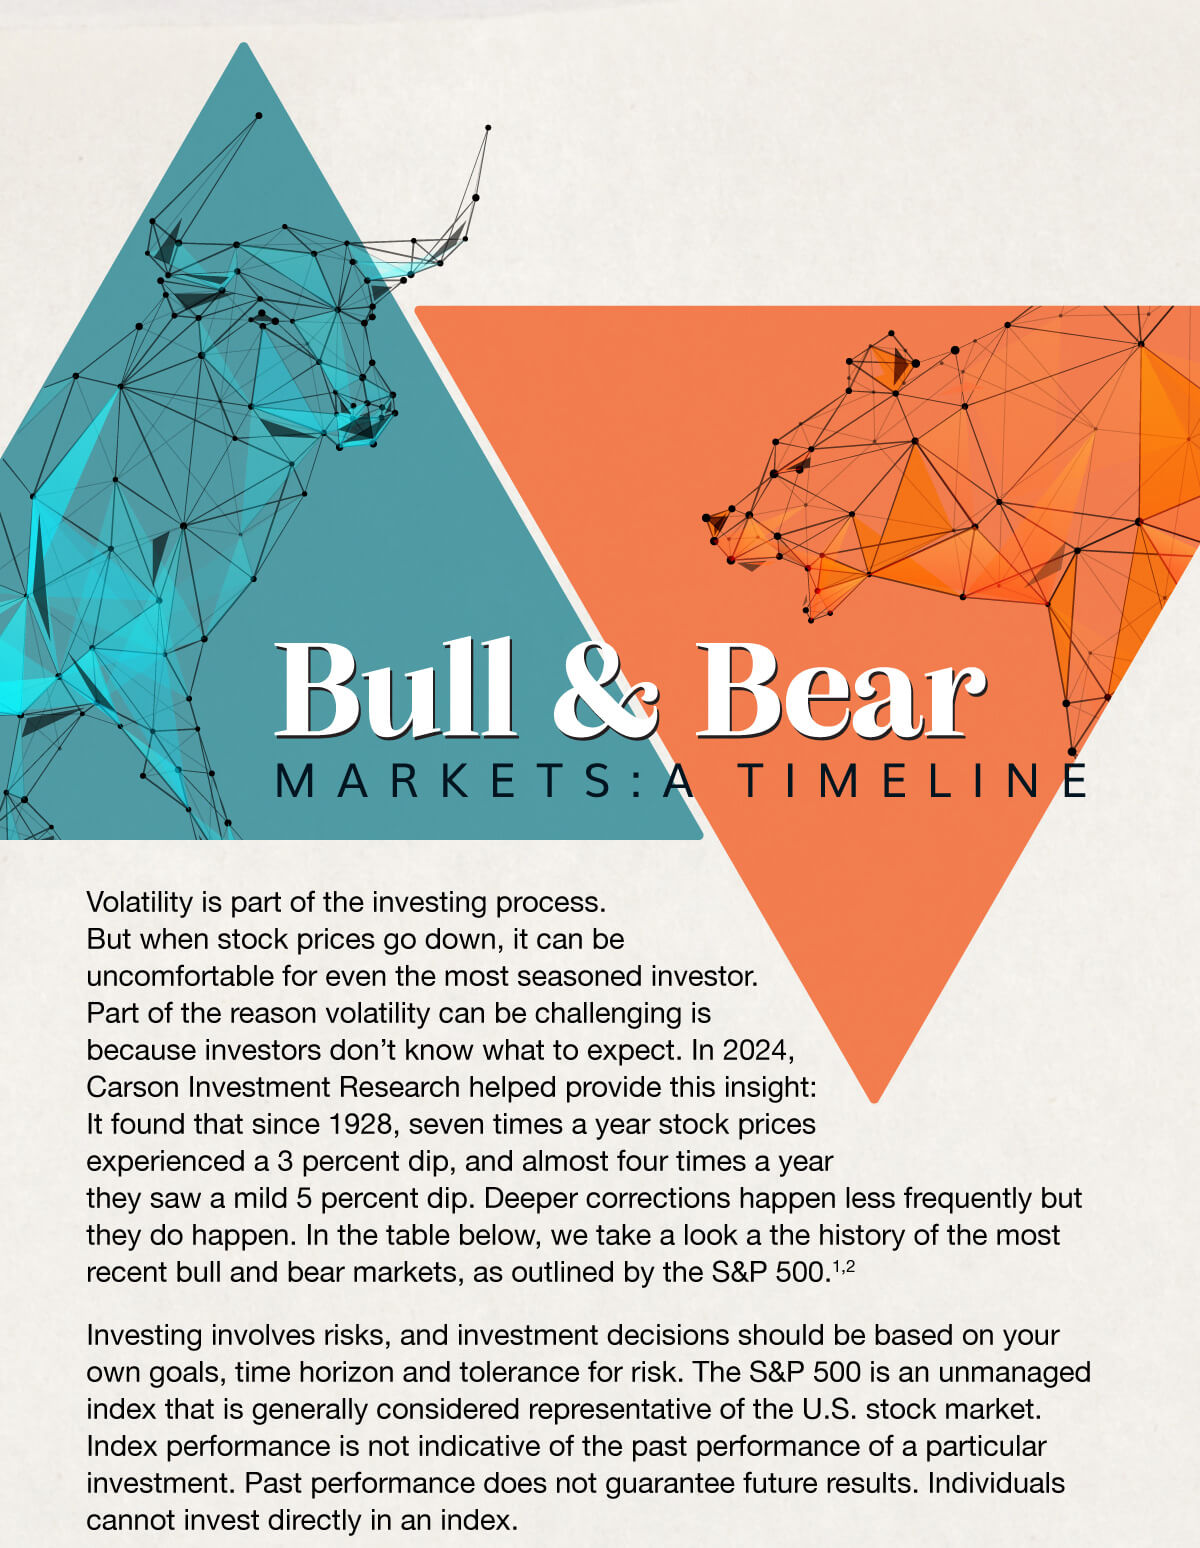
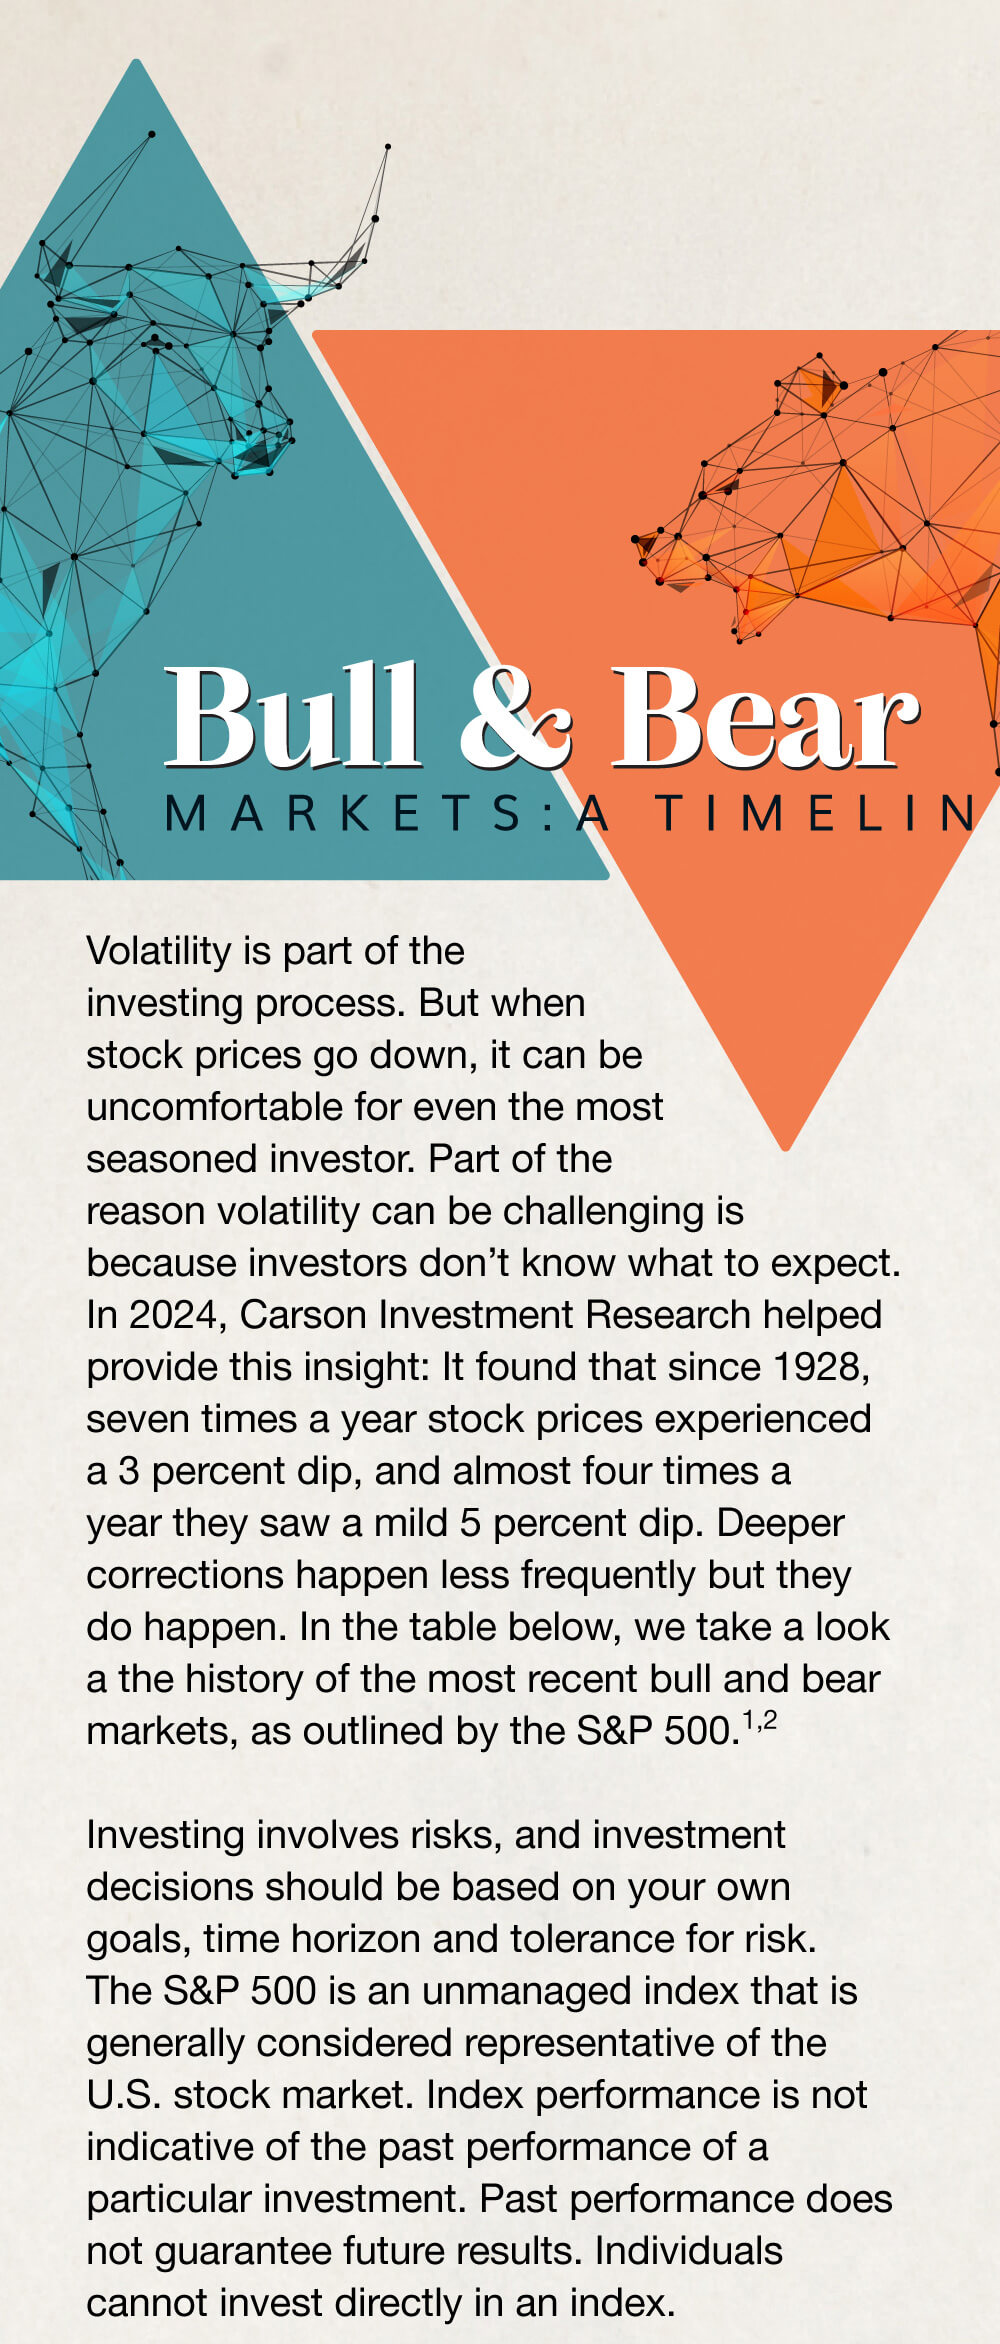
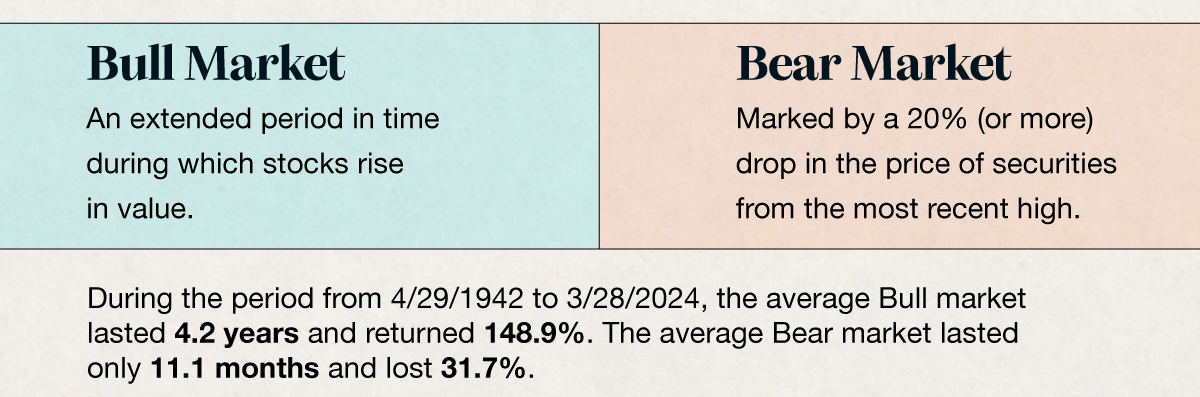
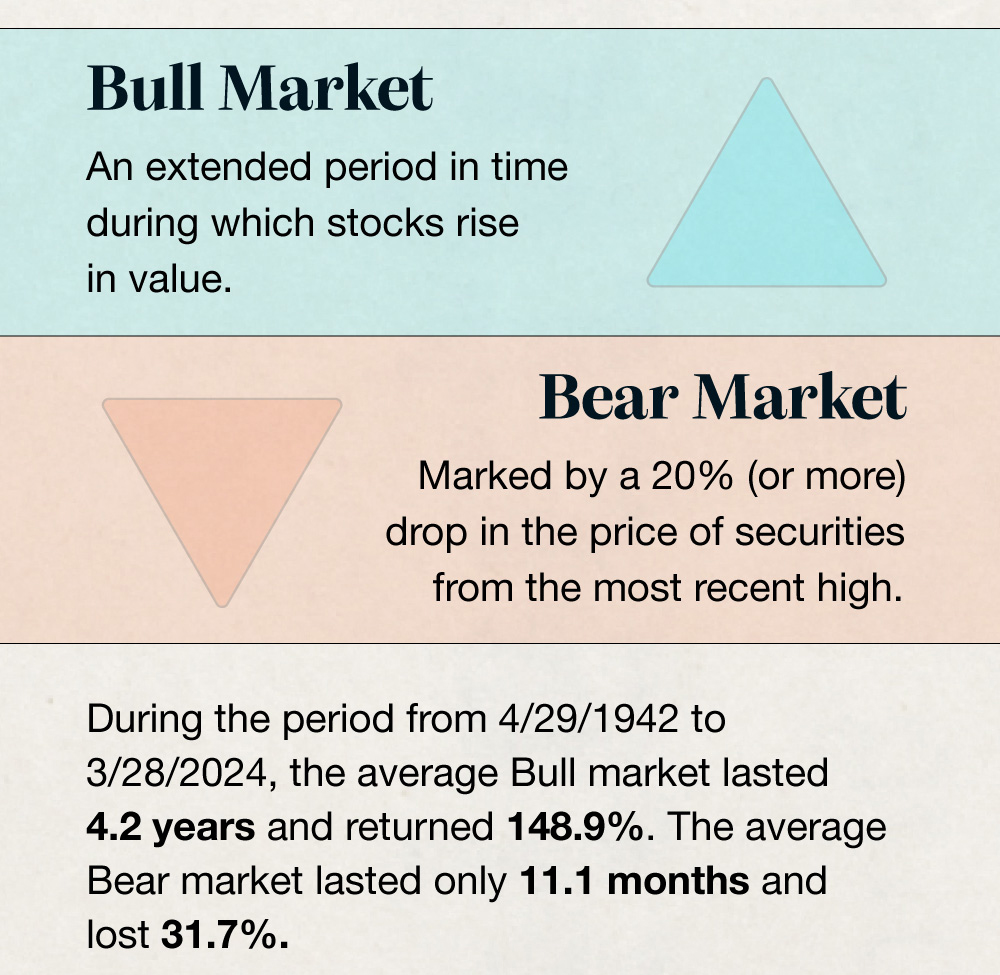
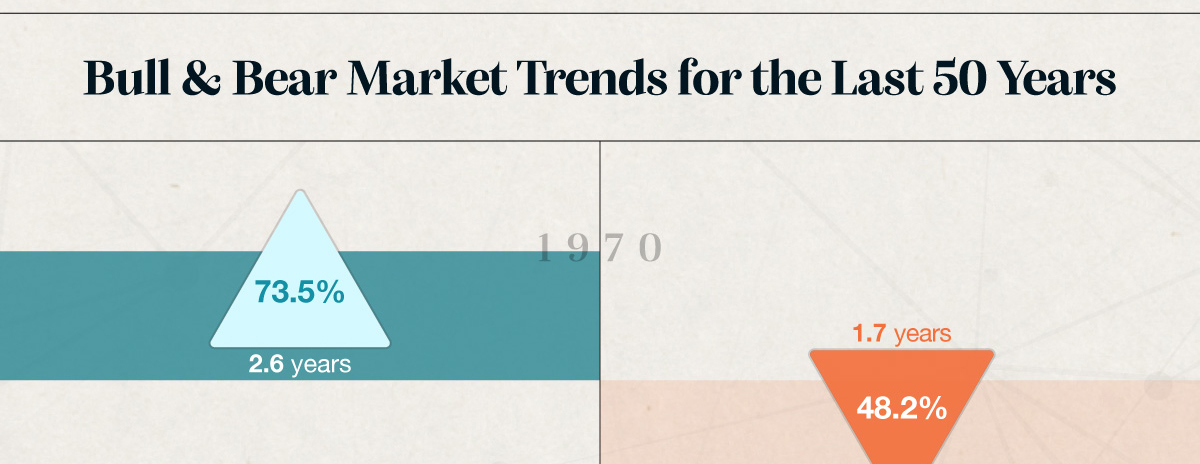
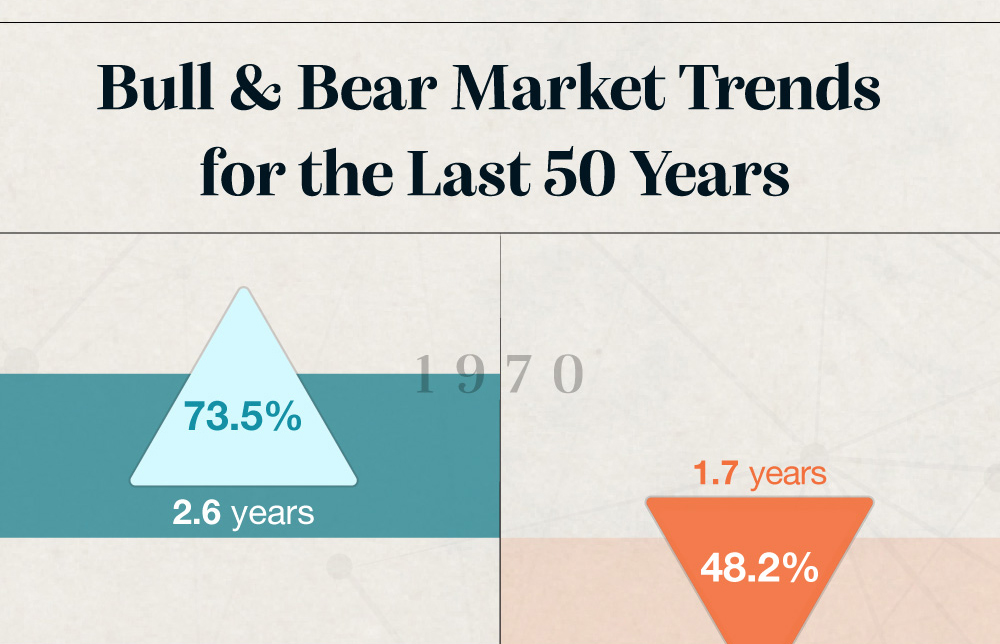
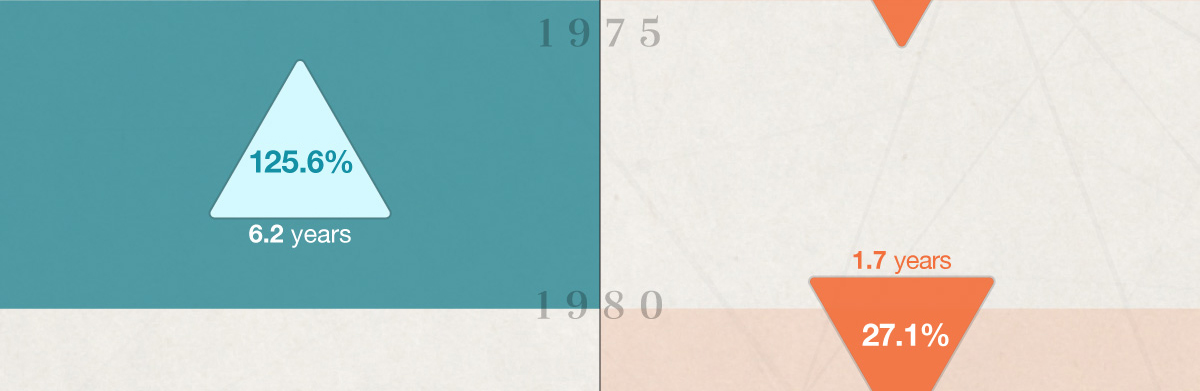
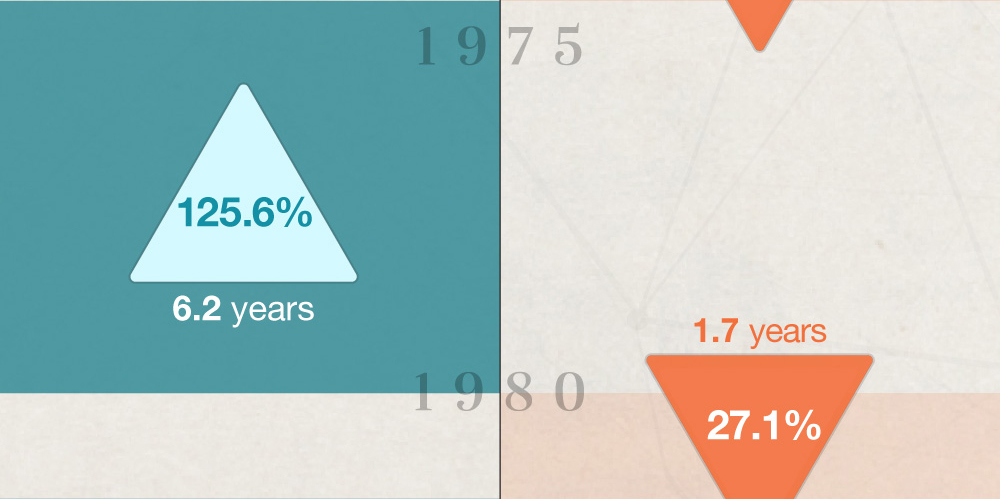
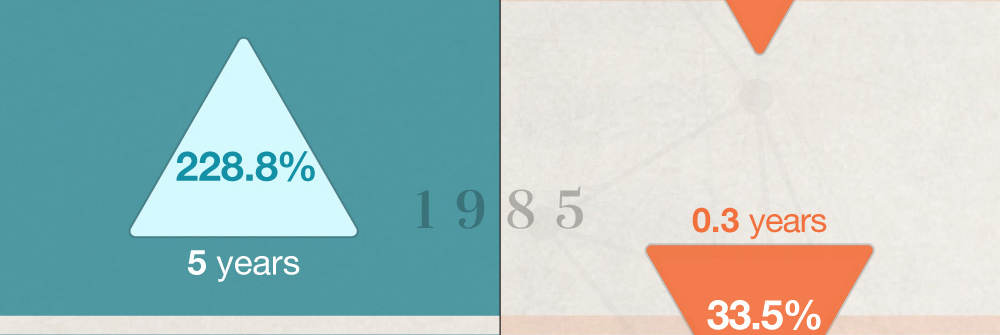
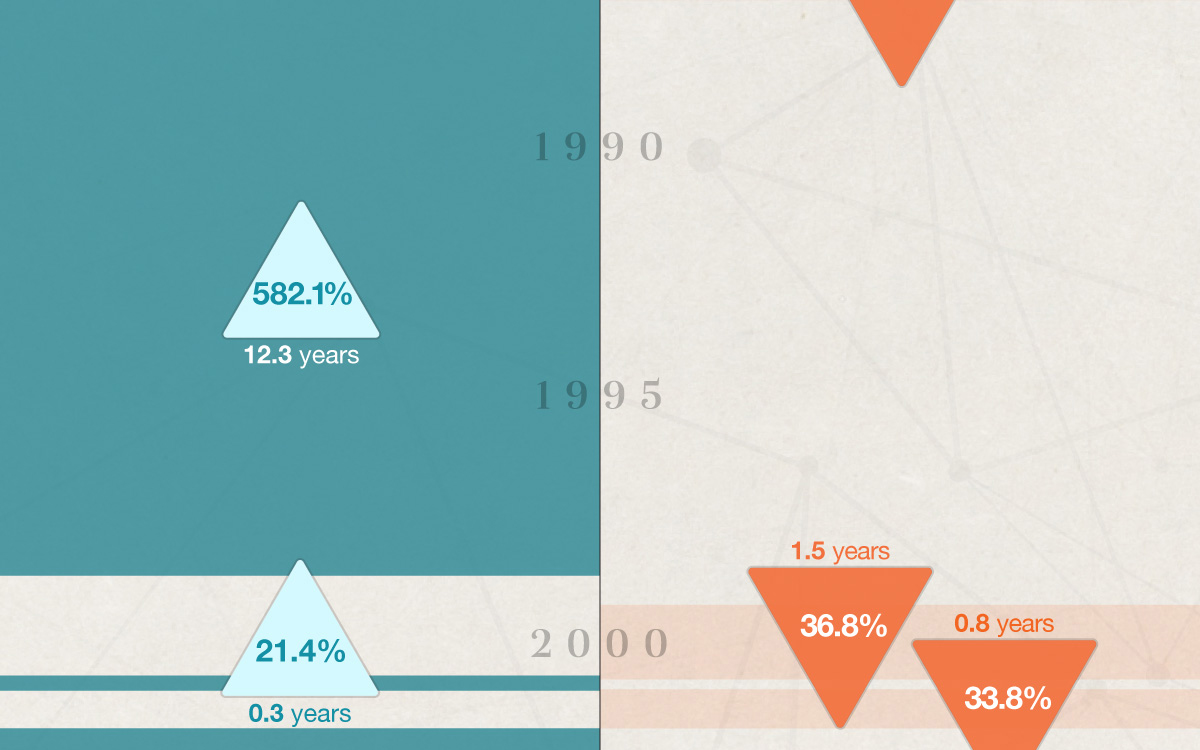
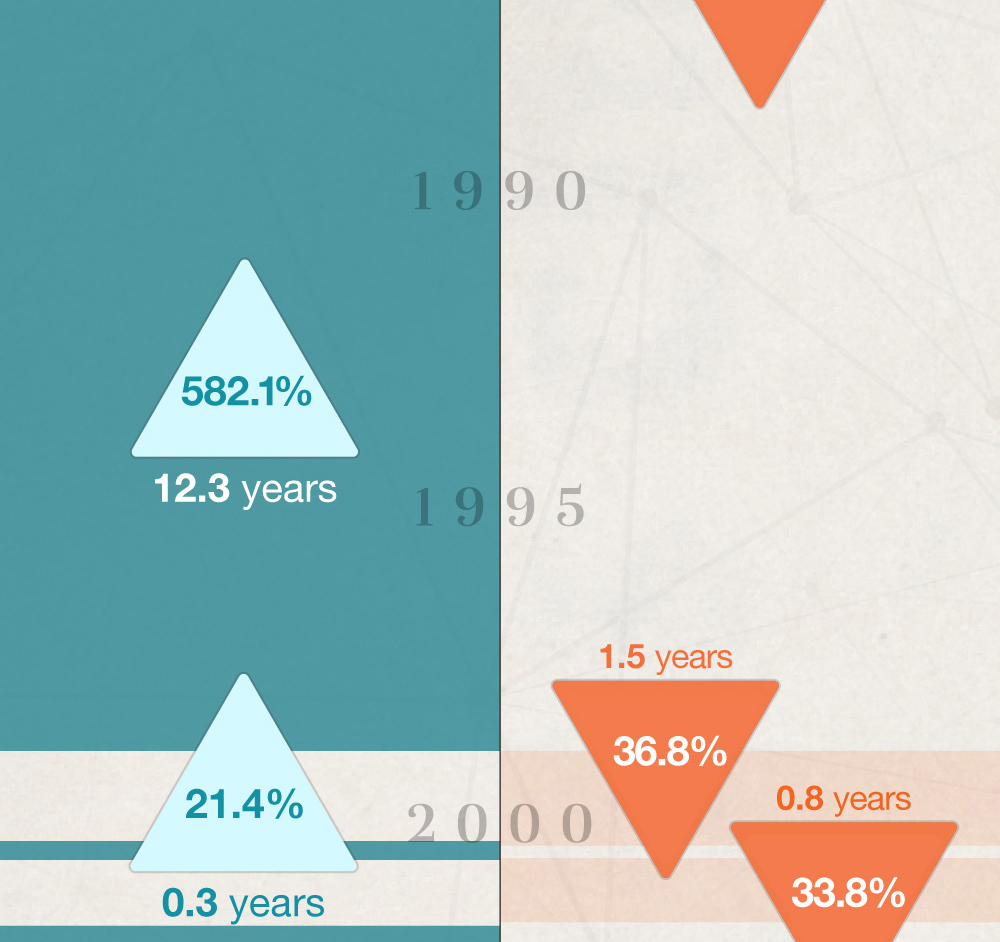
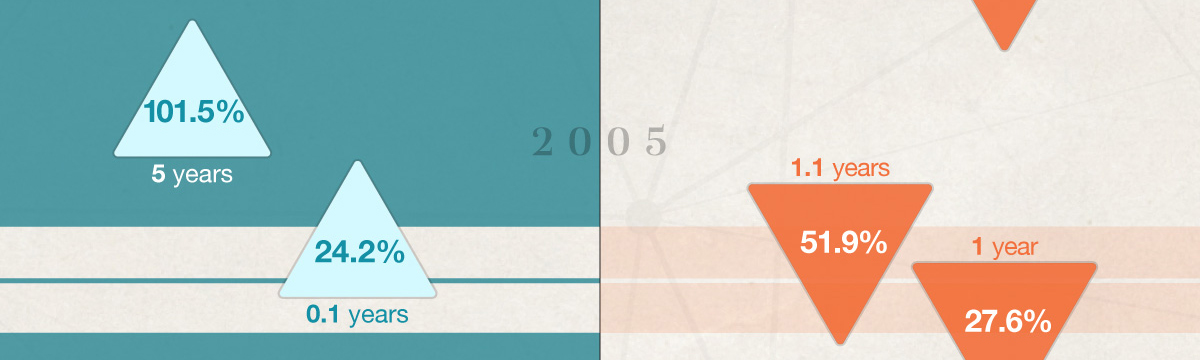
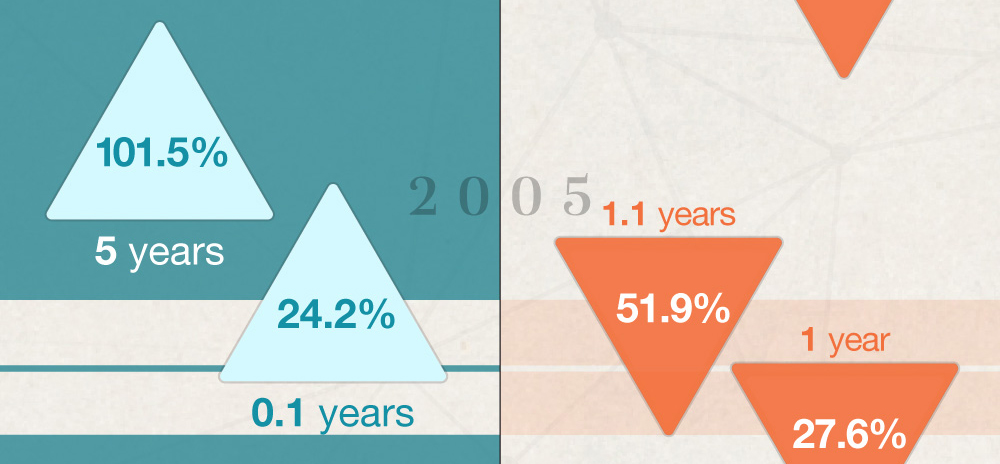
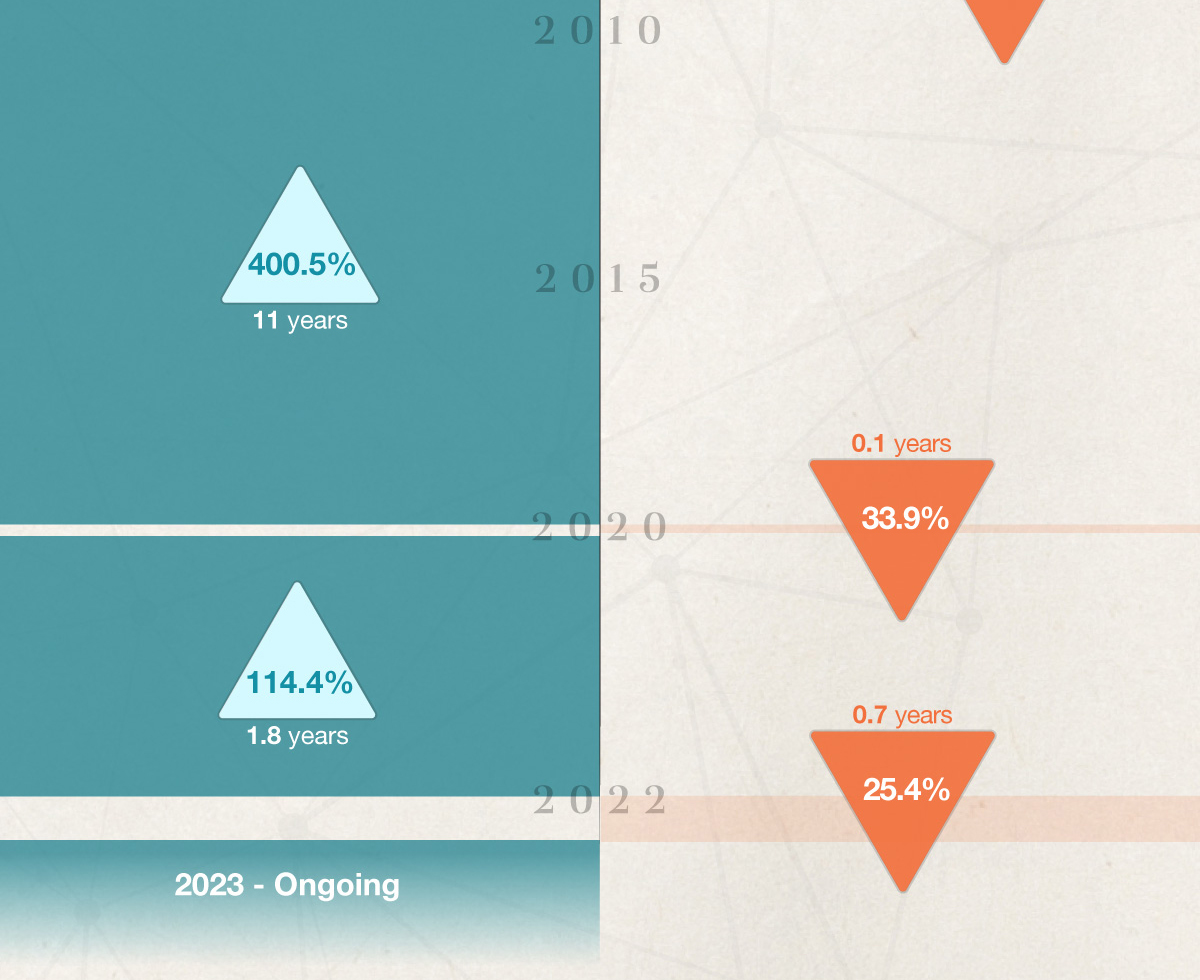
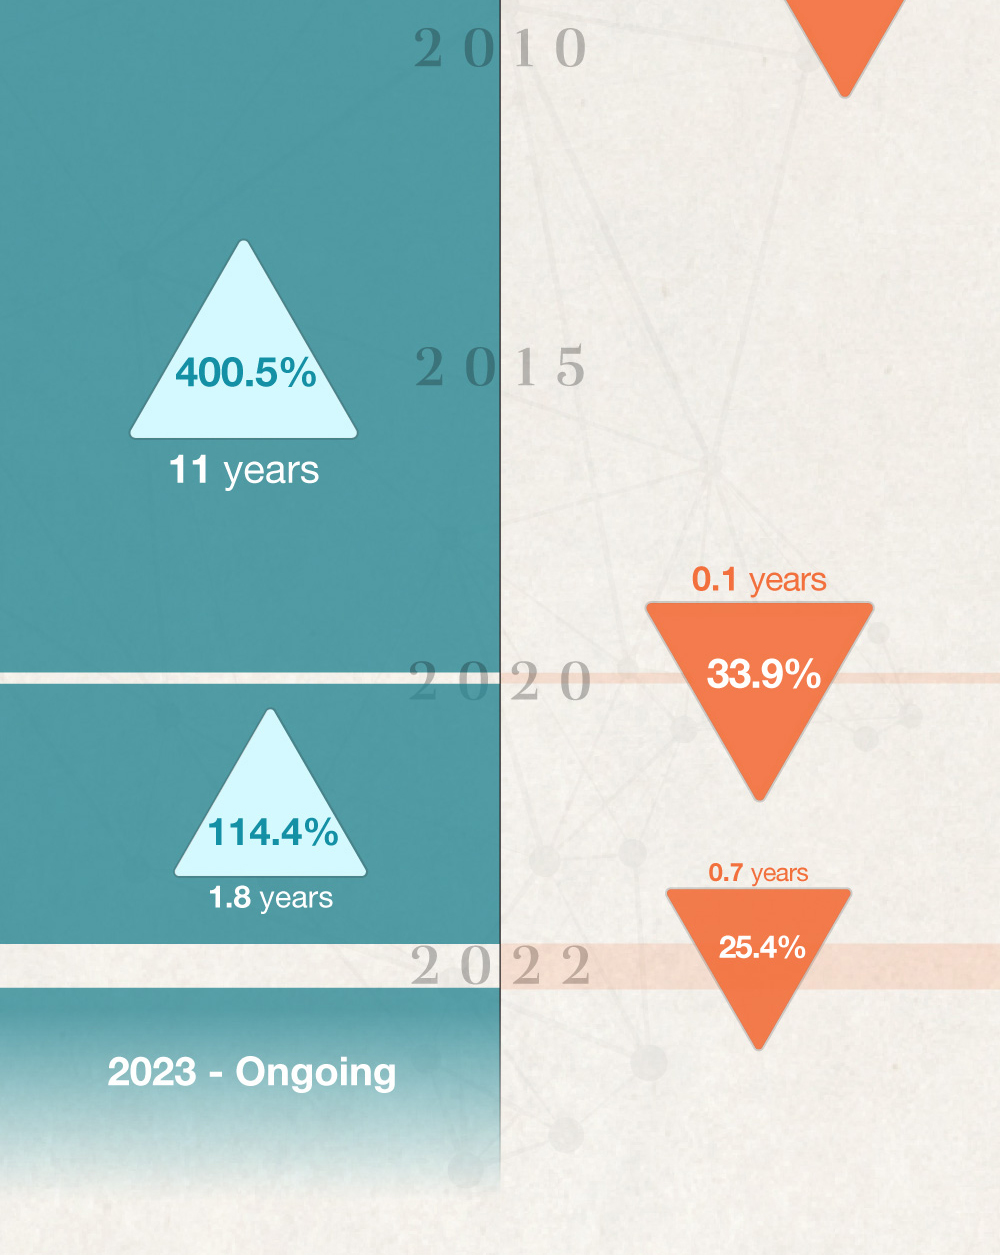
Bull & Bear Markets: A Timeline


Learn about the dangers of internet fraud with this highly educational and fun “pulp” comic.

Investors who put off important investment decisions may face potential consequences to their future financial security.

Selecting a mortgage isn't an easy process. Get a better understanding of how professionals make the right decisions.